Sample Tag Analysis
Sample multiplexing option
Multiple samples of cell suspension can be loaded into a BD Rhapsody™ cartridge using a BD® Single-Cell Multiplexing Kit. Each sample is labeled with a separate Sample Tag from the kit. The human and mouse sample kits provide up to 12 species-specific sample tags. The flex sample kit provides up to 24 species and cell type agnostic sample tags.
When you start the BD Rhapsody™ Sequence Analysis Pipeline, you can select the sample multiplex option. You can associate a name with a Sample Tag before the pipeline starts, and the specified sample names will be used in the output files.
To account for every Sample Tag, each Sample Tag sequence in the kit is considered during pipeline analysis, whether the Sample Tags are used in the experiment or specified with a sample name.
The pipeline automatically adds the Sample Tag barcode sequences to the appropriate reference input files. Reads that align to a Sample Tag sequence and associate with a putative cell are used to identify the sample for that cell.
Sample determination algorithm
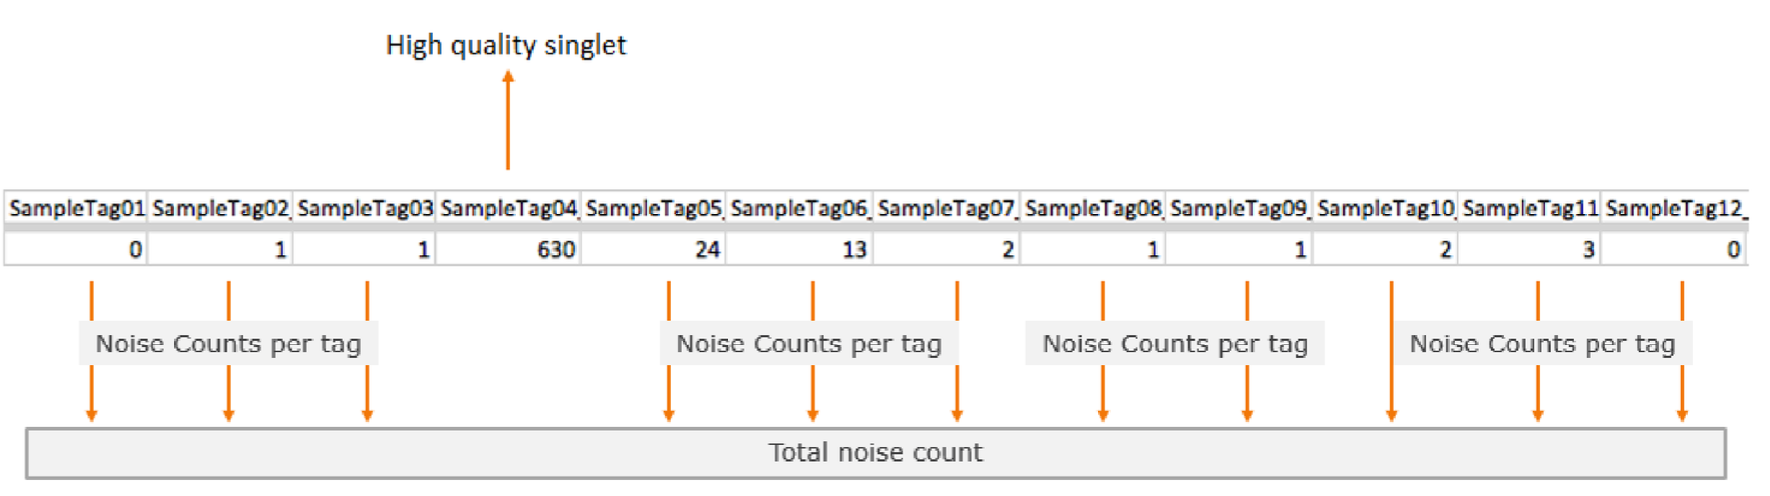
The algorithm first identifies high quality singlets. A high quality singlet is a putative cell where more than 75% of Sample Tag reads are from a single tag. When a singlet is identified, the counts for all the other tags are considered Sample Tag noise. Sources of low-level noise can be: barcode contimination from the oligo manufacturing process, or incomplete washing of individual cell samples, resulting in residual Sample Tag labeling during cell preparation and cartridge steps.
The image below shows an example of Sample Tag read counts for an individual putative cell that is considered a high quality singlet, labeled SampleTag04. All of the other Sample Tag counts are recorded as separate noise counts and are summed to find the noise read count for that putative cell.
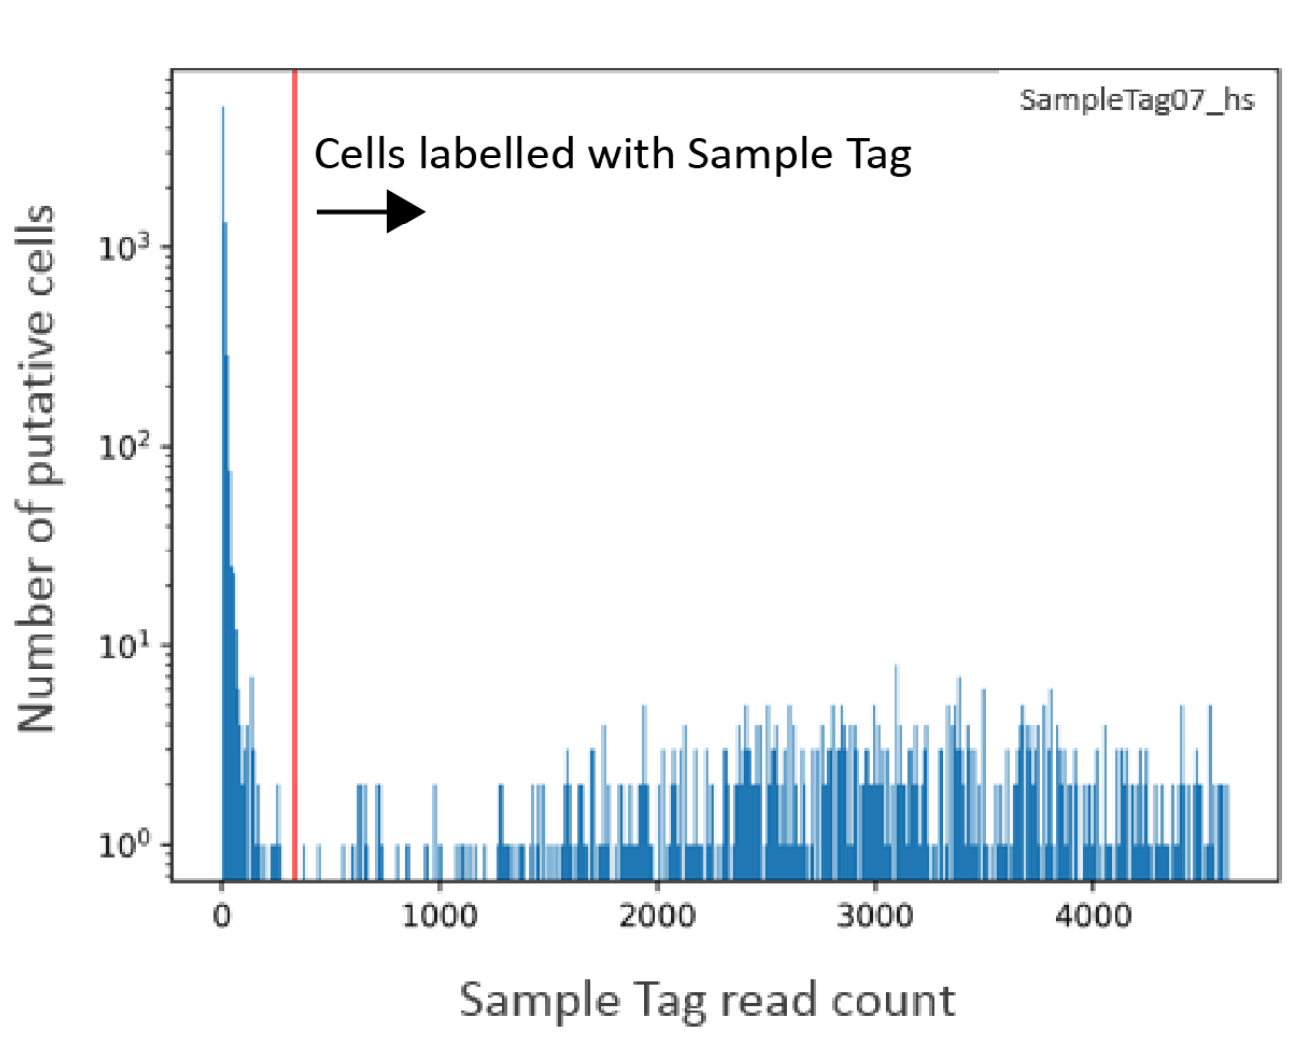
The minimum Sample Tag read count for a putative cell to be positively identified with a Sample Tag is defined as the lowest read count of a high quality singlet for that Sample Tag. The below histogram shows the of number of Sample Tag reads per putative cell for one of the Sample Tags. The red vertical line indicates the threshold of minimum Sample Tag read count. Putative cells with Sample Tag read counts greater than the threshold (to the right of the red line) are considered labelled with this Sample Tag. In addition to singlets, these putative cells can include multiplets, which are cell labels associated with more than one Sample Tag.
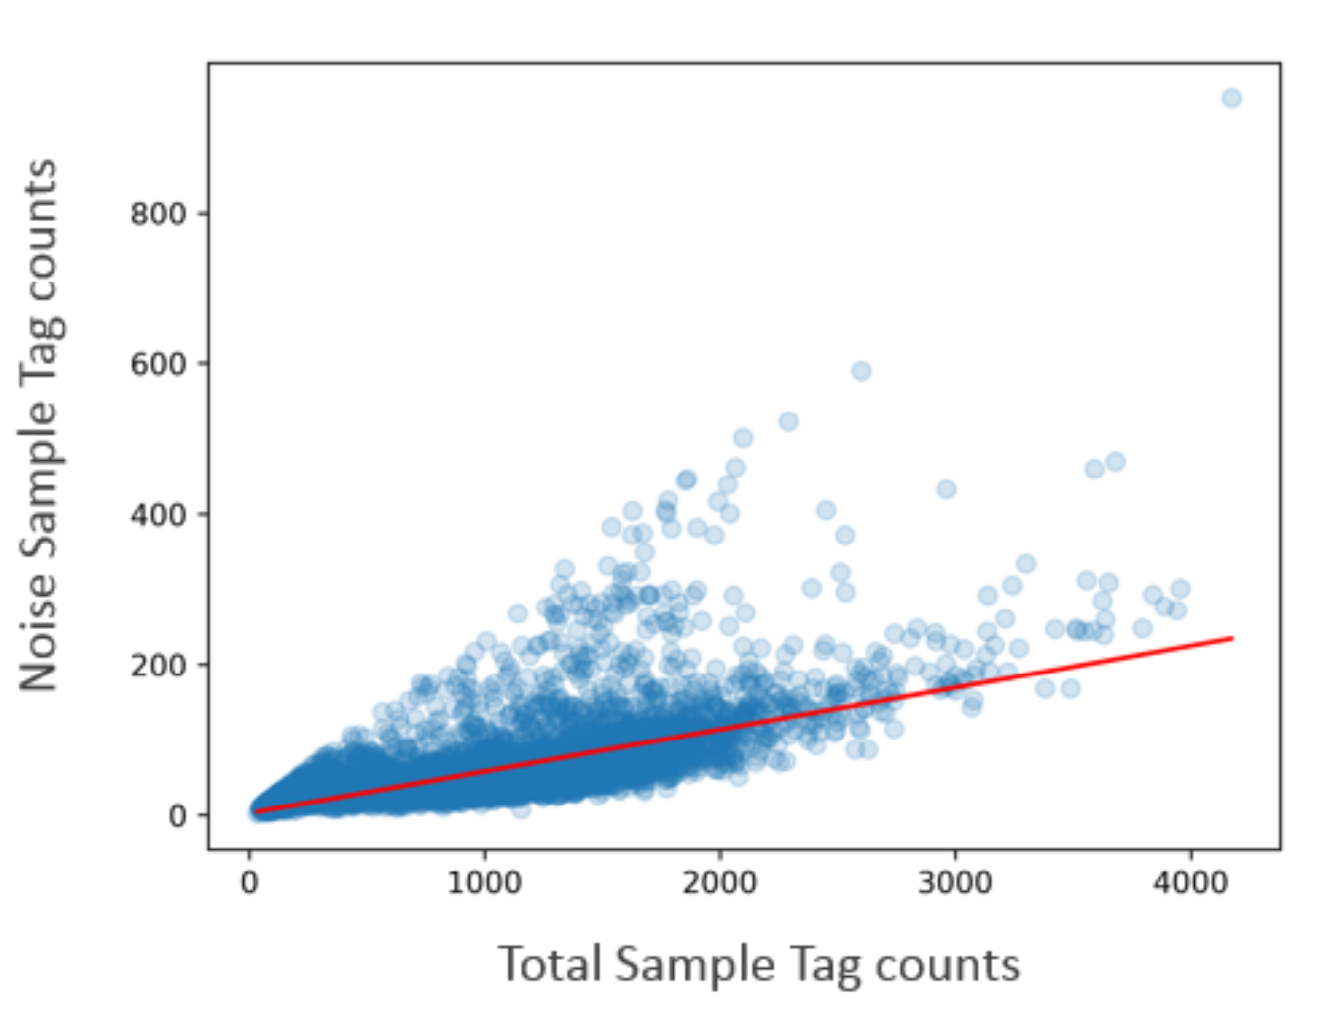
The percentage of noise contribution of each Sample Tag for all cells is calculated by dividing the total per tag noise by the total overall noise. In addition, the total amount of noise versus the total Sample Tag count per putative cell is recorded so that a trend line can be established to estimate the total per-cell noise given an observed number of total Sample Tag count for a cell. The figure below shows an overall noise profile where each dot is a cell. A trend line (in red) is fitted and used to establish the expected amount of noise given a total Sample Tag count. Cells that are off the trend line are likely multiplets. The level of antigen expression across cells can vary, contributing to variation in Sample Tag count per cell. Generally, cells with higher total Sample Tag counts have higher noise Sample Tag counts.
To improve sample determination and recover singlets that are not initially considered high quality, the algorithm subtracts the expected number of per-cell noise counts from each Sample Tag. The total expected per-cell noise, derived from the trend line, is multiplied by the percentage of noise contribution of each Sample Tag to determine the expected noise per Sample Tag.
After subtracting the expected per tag noise, any Sample Tag that has a count higher than its minimum read count is called for that cell, and the putative cell is considered a called cell.
When the counts of two or more Sample Tags exceed their minimum thresholds, then that putative cell is called as a cross-sample Multiplet, indicating more than one actual cell in the microwell, and the cells are of different samples of origin. Some putative cells might not have enough Sample Tag counts to definitively call their sample of origin, and those are labeled as Undetermined.
Reporting sample origin
If you chose the sample multiplexing option, the main top-level RSEC and DBEC data tables contain counts for putative
cells from all samples combined. The sample of origin for each putative cell is listed in the file
<sample_name>_Sample_Tag_Calls.csv. This file can be used to annotate the combined data tables. The file
<sample_name>_Sample_Tag_Metrics.csv reports the metrics from the sample determination algorithm. Data tables and
metric summary for each sample are output in folders contained in <sample_name>_Sample_Tag<number>.zip.