TCR and BCR Analysis
TCR and BCR overview
In combination with other BD Rhapsody™ assays, optional protocols and products enable the generation of sequencing libraries specific to T- and B-Cell Receptors (TCR and BCR). When enabled, the BD Rhapsody™ Sequence Analysis Pipeline can use the reads from these libraries to assemble contigs corresponding to rearranged TCR and BCR chain mRNA. These contigs are then analyzed to identify single-cell level VDJ gene segments, complementary determining regions (CDRs), read and molecule counts, and per cell type chain-pairing. TCR and BCR analysis is supported for human and mouse.
Major TCR and BCR pipeline steps
- Identify reads derived from TCR or BCR mRNA
- Assemble reads into contigs
- Annotate contigs with VDJ gene segment information
- Select dominant contigs and chain family
- Cell analysis - type and quality
- Error correction and contig trimming
- Clonotyping
Identify reads derived from TCR or BCR mRNA
As described in earlier steps, reads are aligned against a reference sequence to determine their biotype and identity (for example, which gene, AbSeq, sample tag, or VDJ gene segment).
For the WTA assay, in combination with TCR and BCR, the pipeline will identify TCR or BCR reads which align to known VDJ gene segments in the transcriptome, with the appropriate orientation. Known VDJ segments are those with a transcriptome GTF “gene_biotype” starting with “TR_”or “IG_”.
For the targeted assay in combination with TCR and BCR, the pipeline automatically adds species appropriate TCR and BCR gene segments to the FASTA reference file. These gene segments are derived from the same Gencode transcriptome GTF as is used in the pre-built WTA assay reference archives.
Reads that align to TCR or BCR gene segments are grouped and separated from the reads aligning to other biotypes. These reads then only go through the procedures described in the remainder of this section, and not the steps described previously for other biotypes.
Assemble reads into contigs
To generate the full variable region of a TCR or BCR sequence, or the consensus CDR3 sequence, short reads must be assembled. Read assembly operates by looking for similarities and overlaps between reads that suggest they originate from the same original sequence. Aligning and stitching these reads together can allow for the creation of longer contigs from short reads, and correct randomly distributed sequencing errors.
Reads identified as TCR or BCR derived, are prepared for assembly with trimming and UMI error correction. First, the 3’ end of reads are trimmed with a quality score threshold of 20. It’s important that the reads going into assembly be of high quality, so that reads can be correctly aligned, and a valid consensus sequence can be generated. Next, reads are also trimmed based on bead capture sequences to remove artifacts from the BD Rhapsody™ cell label sequence. These sequences could interfere with the correct assembly, and may be found at the 3’ end of TCR or BCR reads if they were derived from short amplicons. Then, reads undergo UMI error correction, grouped by their cell ID and the TCR or BCR chain type determined by initial alignment (for example, TCR-Alpha, IG-Kappa...). This UMI error correction step uses the same RSEC algorithm described previously.
To begin assembly, reads are grouped by cell ID and chain type and assembled using Inchworm, part of the Trinity transcript assembly package. The reads are then aligned back to the resulting contigs using minimap2. These alignments are used to count reads and unique corrected UMIs (molecules) for each contig. If Inchworm does not produce any contigs, the input read sequences are used as candidate contigs for that cell–chain group.
For cell–chain groups with fewer than 10,000 reads before downsampling, contigs generated by Inchworm are refined using the read alignments. A consensus sequence is generated from the contig and aligned reads to correct errors. Soft-clipped read sequences extending beyond either end are used to generate a consensus extension for that end. This allows partially assembled contigs to be extended. Contigs without supporting read alignments are discarded.
Multiple contigs from each cell can represent the rearranged VDJ mRNA sequences of different chains, such as TCR Alpha and TCR Beta.
Prior to pipeline version 3.0, assembly used the full Trinity workflow. Starting with version 3.0, the pipeline uses Inchworm followed by contig refinement, as described above. Internal benchmarking showed generally equivalent or slightly better metrics, with assembly running 7–23 times faster than the full Trinity workflow.
Annotate contigs with VDJ gene segment information
All contigs generated by the assembly step are analyzed to identify V, D, J, and C gene segments, complementarity determining regions (CDR1-3), framework regions (FR1-4), productivity (lack of stop codons), if contig is full length, and protein sequence. This analysis is accomplished with a software package called IGBlast.
A contig is removed from further analysis if a V or J gene selection is of low quality, indicated by an e-value score greater than 10-3 (lower is better). A contig is considered “full length” when there is amino acid sequence defined for each framework (1-4) and CDR (1-3) region. For the “full length” metric, FR1 and FR4 may be partial, but the overall contig is still considered full length.
All annotated contigs are written to an unfiltered AIRR compliant output file.
Select dominant contigs and chain family
For each cell and chain type, a dominant contig is selected to facilitate reporting, metrics, and downstream analysis. The selection of a dominant contig follows these rules:
-
Read count of the contig is at least 20% of the total read count from all contigs for the cell-chain.
-
To break any ties, the contigs are then sorted in order of: productivity, highest molecule count, highest read count, full length, and best V-segment e-value quality score.
Secondary contigs can be generated due to biological reasons, like dual expression of alpha or beta TCR chains expression or assay-based reasons, like: sequencing errors, transcription errors, contaminating reads from other mRNAs, cell multiplets, and misassembly.
Dominant contigs for chain types that do not correspond to the cell type selected (described below) are not reported in the dominant contigs output file, but all contigs are available in the unfiltered contigs output file.
For cells expressing both TCR alpha/beta and TCR gamma/delta, a single chain family is selected for the final "per cell" output file, but all data is still available in the uncorrected output. To select the chain family, expression of both alpha and beta or gamma and delta is preferred. Then, if all 4 chains or one of each chain has expression, the family with the highest combined molecule count is selected (alpha+beta vs gamma+delta).
Cell analysis - type and quality
During any BD Rhapsody™ assay in combination with TCR and BCR, putative cell determination is still based on 3’ gene expression from targeted or WTA data. This is more accurate than creating separate putative cell identifications for the TCR and/or BCR libraries. The VDJ metrics contain a breakdown of metrics by cell type. Cell types are determined in one of two ways. The pipeline contains an experimental immune cell type classifier that uses a series of machine learning models developed on human PBMCs. This method will only work when the targeted or WTA gene expression, or AbSeq expression data tables contain a sufficient number of core genes/AbSeqs relevant to the model.
The TCR and BCR algorithms contain a simple fallback for cell type determination, in the case of human data where gene expression was not available for a sufficient number of core genes, or for mouse data:
- A putative cell with 2x more TCR molecules than BCR molecules, (or only TCR data) is a T cell
- A putative cell with 2x more BCR molecules than TCR molecules, (or only BCR data) is a B cell
- A putative cell without a 2x difference, or one without any TCR or BCR data is unknown
Cell type determination by the fallback mechanism may be different in unfiltered data vs corrected data.
Cells are then further classified according to their quality. High-quality B or T cells are those that match these criteria:
- Called a B or T cell by the above cell type classification algorithm
- Contains at least 1 productive contig from a cell type appropriate BCR or TCR chain type
- Contains at least 4 molecules from cell type appropriate BCR or TCR chain type(s)
A 'high-quality' column in the perCell and contig output files show whether a cell satisfied these criteria. Then, an additional set of per cell VDJ metrics is computed. These high-quality metrics are similar to other single-cell VDJ products where there is a putative cell determination for VDJ libraries alone, separate from the putative cell determination from associated gene expression libraries.
Error correction and contig trimming
Dominant contigs from putative cells undergo two additional steps before final reporting. First, the 3’ end of contigs are trimmed based on the identified constant region and the known primer sequence it contains. Any assembled sequence 3’ of the primer sequence, within the constant region, is not consequential to the VDJ region, and possibly assembled in error.
To improve specificity, dominant contigs from putative cells undergo a final round of error correction on a per chain type basis: for each of TCR alpha, beta, gamma, delta, and BCR heavy, kappa, and lambda. This distribution style error correction assumes that each individual chain type from T or B cells will amplify at similar rates, and thus would end up with similar numbers of reads per cell-chain for a real TCR or BCR expressing cell. Artifact molecules created with non-T or non-B cell labels in late PCR cycles, such as those derived from PCR chimera formation, will likely have fewer reads. The algorithm is multi-modal aware, so that if there are 2 positive populations for a particular chain, they should both be kept (for example, Naïve B cells and plasma B cells with different reads per cell in the same experiment).
First, there is a check to determine if each chain type has a read depth of at least 4 reads per cell. If not, then error correction does not proceed for that chain type. Next, a histogram of the reads per cell from each chain type is generated, and a multi-modal distribution is modeled on each. A threshold is set at the local minima between the first and second modes, and on a per chain basis, any TCR or BCR data from cells whose reads counts are in the lowest mode are removed.
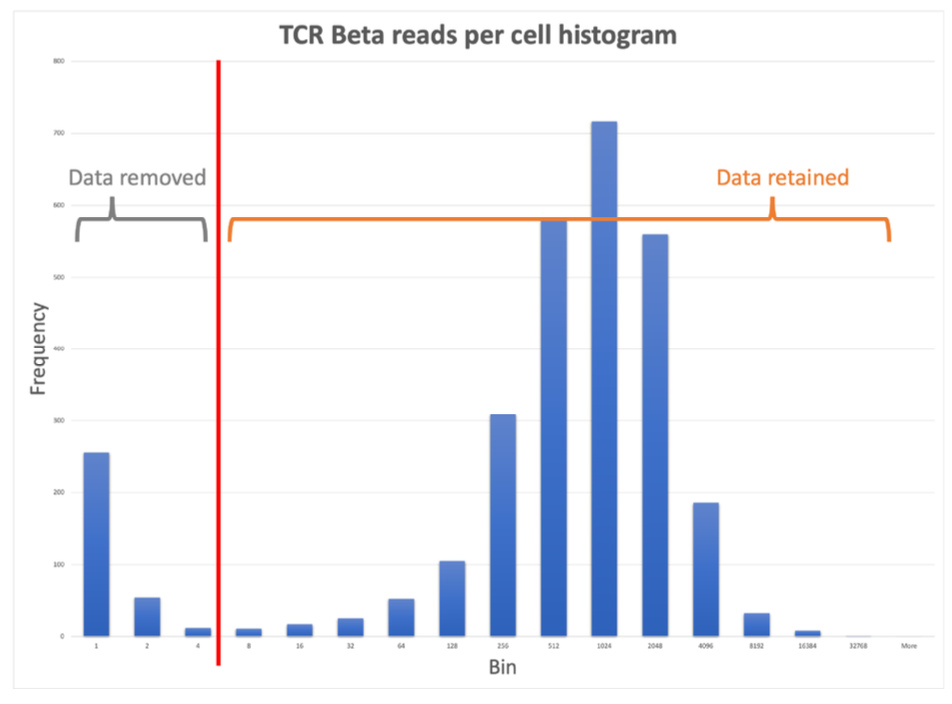
There are two exceptions where contigs will be retained, even if they fall below the threshold for that chain:
- The cell chain contig has a unique CDR3 that is not seen in other cells
- The CDR3 paired data matches exactly to another cell that had both chains pass filter (i.e. there is another alpha-beta T cell clone with the same CDR3 pair)
Untrimmed contigs and contigs before error correction are still available in an unfiltered contigs output file.
Clonotyping
Clonotyping groups cells that share a common V(D)J rearrangement. Only productive dominant contigs with a CDR3 call from putative B and T cells are used for clonotyping.
T cells are grouped into clonotypes if they have the same V and J gene annotations and identical CDR3 nucleotide (NT) sequences.
Since incomplete alignments can make it difficult to assign an allele-specific gene call accurately, allele information is discarded during comparison.
For example, TRAV1-1*01 and TRAV1-1*02 are considered equivalent. Information from both chains is used: cells are first grouped by their
beta or delta chain (V, J, CDR3), and these groups are then split based on differences in their alpha or gamma chain (V, J, CDR3).
Since B cells can undergo affinity maturation following antigen exposure, clonotyping allows for nucleotide differences introduced by somatic hypermutation when comparing heavy chain CDR3 sequences. To determine a suitable cutoff, we first construct a nearest-neighbor CDR3 distance distribution. Heavy chain sequences are grouped by their V and J gene assignments (with allele information removed) and CDR3 NT length. Within each group, we calculate the normalized Hamming distance between each unique CDR3 NT sequence and its most similar distinct sequence. This distance is the percentage of nucleotide positions that differ between the two sequences.
The distance distribution is generally bimodal, with the left mode representing sequences from the same clonal families and the right mode representing clonally distinct sequences. However, the distribution is not always clearly bimodal, and even when two modes are present, the valley between them may not be clear. We therefore estimate a cutoff that best separates these two populations using two automated methods: kernel density estimation (KDE) and a two-component Gaussian mixture model (GMM). KDE identifies the valley between modes, while GMM selects a cutoff that maximizes the weighted sensitivity and specificity of the fitted populations.
The final threshold is selected as follows:
- If either method gives a threshold at or below the default of 15.0%, the highest threshold at or below 15.0% is selected.
- Otherwise, the lowest detected threshold is selected, capped at 30.0%.
- If neither method gives a threshold, the default of 15.0% is used.
This approach favors a more permissive cutoff up to the default threshold and a more conservative choice when both estimates exceed it.
Once the threshold is established, cells are grouped by their heavy chain V and J gene calls (with allele information removed) and CDR3 NT length. Within each group, CDR3 sequences are clustered by linking sequences whose distance is at or below the threshold. Sequences connected through intermediate sequences belong to the same cluster. These groups are then split using light chain V and J gene calls (with allele information removed) and exact CDR3 NT sequence matches to form the final clonotypes.
Each clonotype is assigned an identifier with the following format, similar to that used by the dandelion analysis package:
{prefix}_VDJ_{vj_group}_{len_group}_{seq_group}_VJ_{vj_group}_{len_group}_{seq_group}
The fields are:
prefix: receptor type, i.e.B(BCR),abT(alpha-beta TCR), orgdT(gamma-delta TCR).vj_group: an integer identifying a group with the same V and J gene calls.len_group: the CDR3 NT sequence length.seq_group: an integer identifying a CDR3 NT sequence cluster within a group with the same V and J gene calls and CDR3 length.
Cells with only one chain use Unknown for the missing chain:
- VDJ chain only:
{prefix}_VDJ_{vj_group}_{len_group}_{seq_group}_VJ_Unknown - VJ chain only:
{prefix}_VDJ_Unknown_VJ_{vj_group}_{len_group}_{seq_group}
Clonotype identifiers are available in the clone_id column of the dominant and unfiltered contigs AIRR files and in the
Clone_ID column of the per-cell files.
Contig data are also stored in the .cellismo file under the airr modality and can be analyzed in the
BD Cellismo™ Data Visualization Tool.
In Cellismo, you can customize many of the above settings to create new clonotype definitions.
For example, you can set the CDR3 distance cutoff interactively on the distance histogram or allow CDR3 sequence differences
in the light chain.